01
Food structure: cross-section and callouts
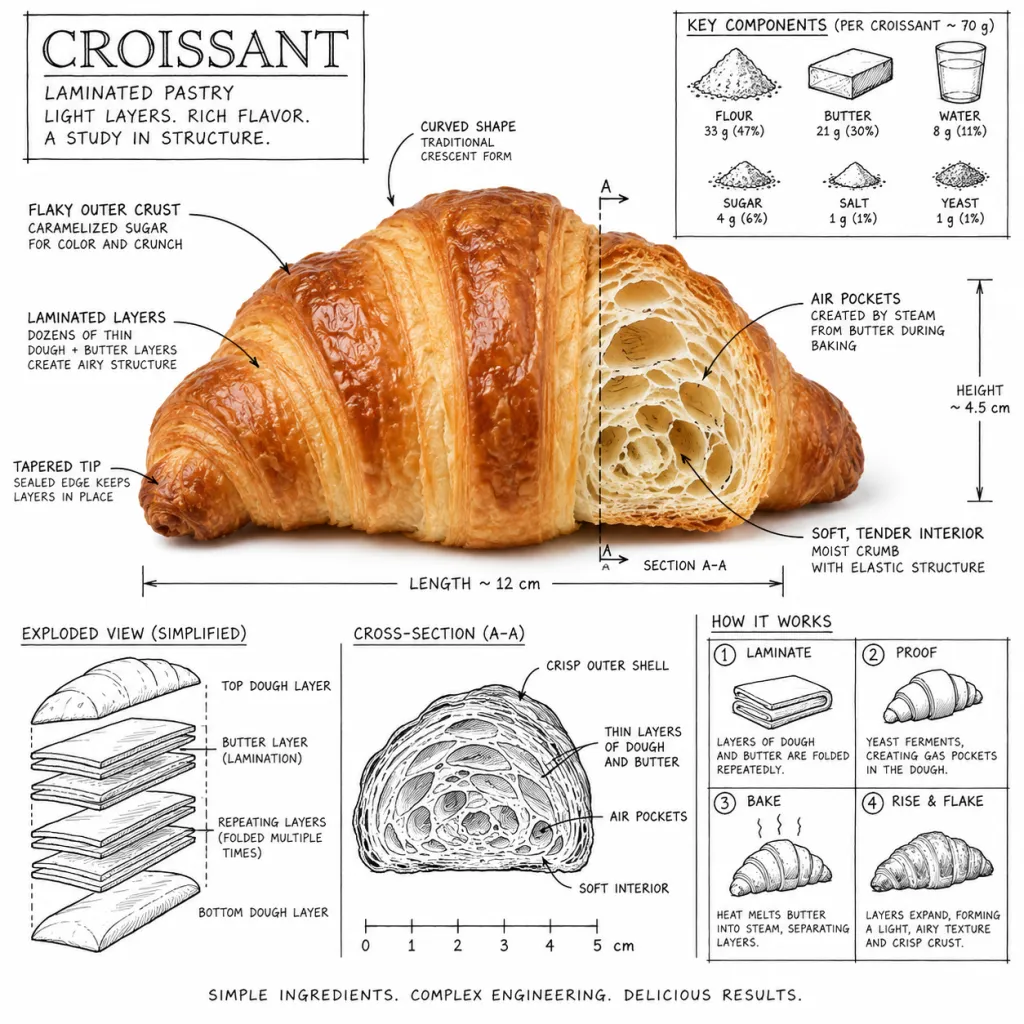
The large cross-section gives the smaller diagrams a common reference. Use one hero cutaway and a few verified callouts rather than surrounding it with dense labels.
View prompt & sourceThe FramePond field guide · 12 examples
Choose an infographic layout by the relationship you need to explain. A sequence needs a path, a comparison needs aligned columns, and a physical object may need a cutaway. Adding more labels rarely fixes the wrong structure.
Explore the examples01 / The brief
This selection of AI-generated images spans food, products, maps and educational posters. Use the examples for composition and visual hierarchy. Facts, measurements and labels still need to come from a source you have checked; a convincing illustration is not a verified diagram.
Write the main takeaway and the supporting facts before requesting an image. Decide what belongs in the title, the diagram and the captions. Supply exact numbers and units for a chart, or an explicit ordered list for a process. Leave out any claim that has no role in explaining the idea.
Use a process for ordered steps, a timeline for change over time, an exploded view for physical layers, and a chart for quantities. Ask for clear separation, consistent label placement and a visible reading order. A decorative map can set the scene, but it should not substitute for accurate geography.
Generate a visual draft, then inspect every label and connection. For exact text, request blank label spaces and add the wording in a design editor. Plot numerical charts with a charting tool, then compose the illustration around the verified chart. Keep editable text and a source list for revisions.
02 / The gallery
Browse the images and adaptation notes freely, and unlock full prompts on their detail pages. Pro subscribers can generate images here, or copy prompts into an image tool of their choice.
The large cross-section gives the smaller diagrams a common reference. Use one hero cutaway and a few verified callouts rather than surrounding it with dense labels.
View prompt & source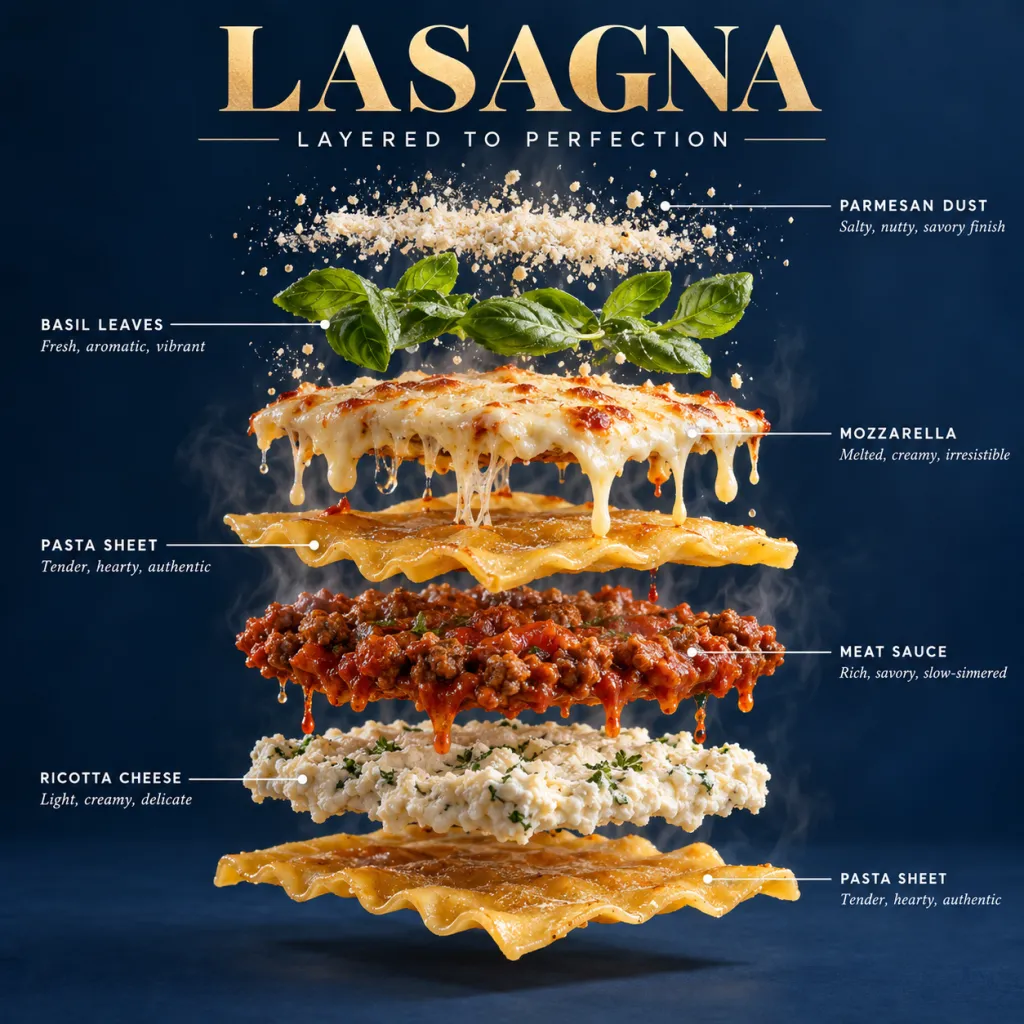
Vertical separation makes the stack readable. Name the layers in order and leave enough space for connectors; verify that each label points to the correct ingredient.
View prompt & source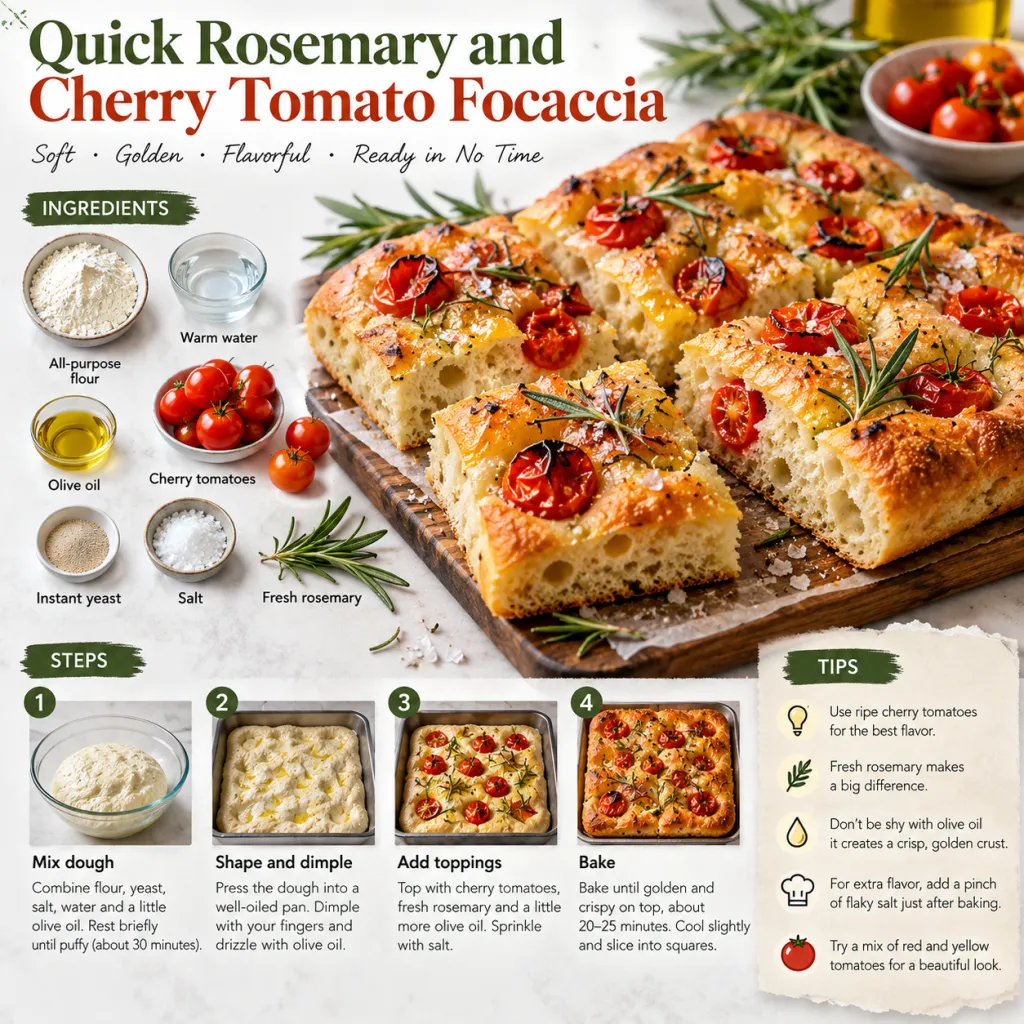
The finished dish anchors the page while smaller panels carry the steps. Supply an exact sequence and check that ingredient amounts and cooking instructions match your tested recipe.
View prompt & source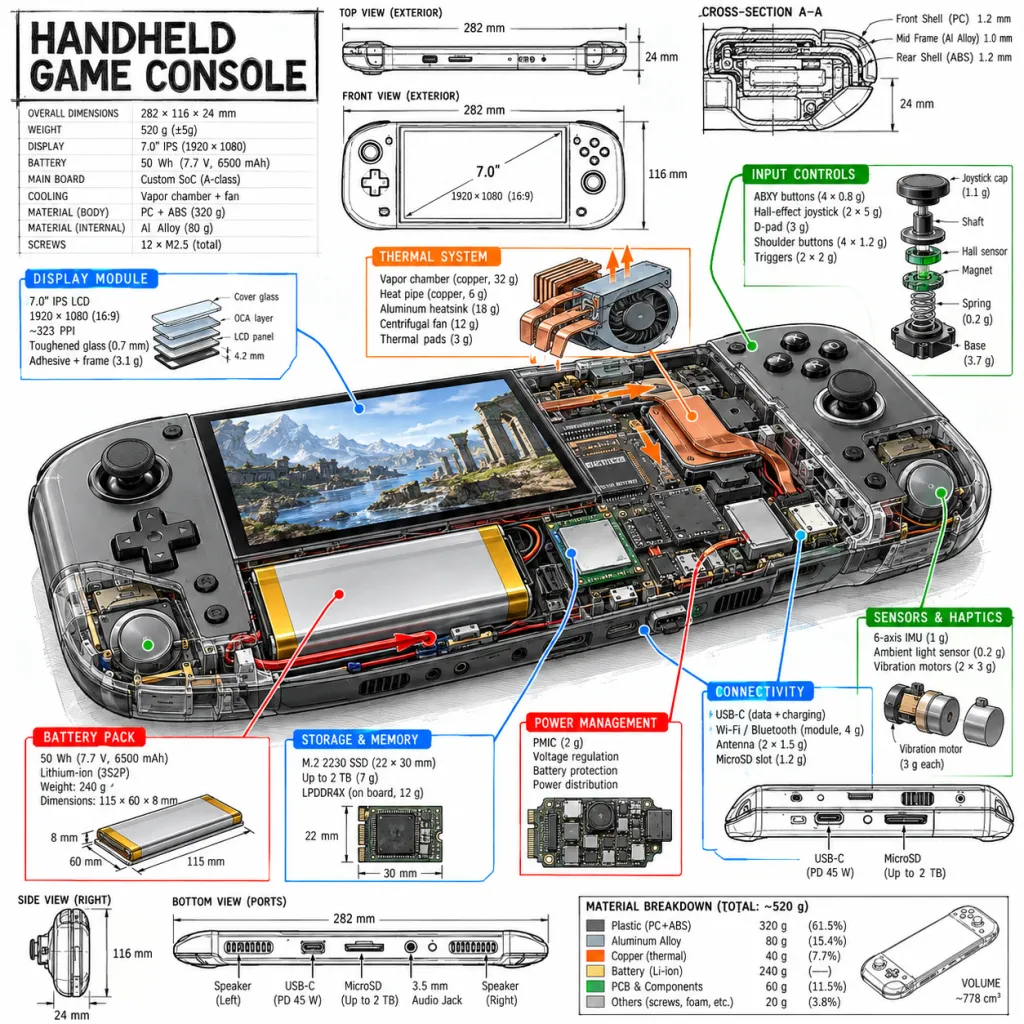
The central device connects the external shape with internal parts. For technical use, base the labels and component placement on actual documentation rather than a plausible-looking render.
View prompt & source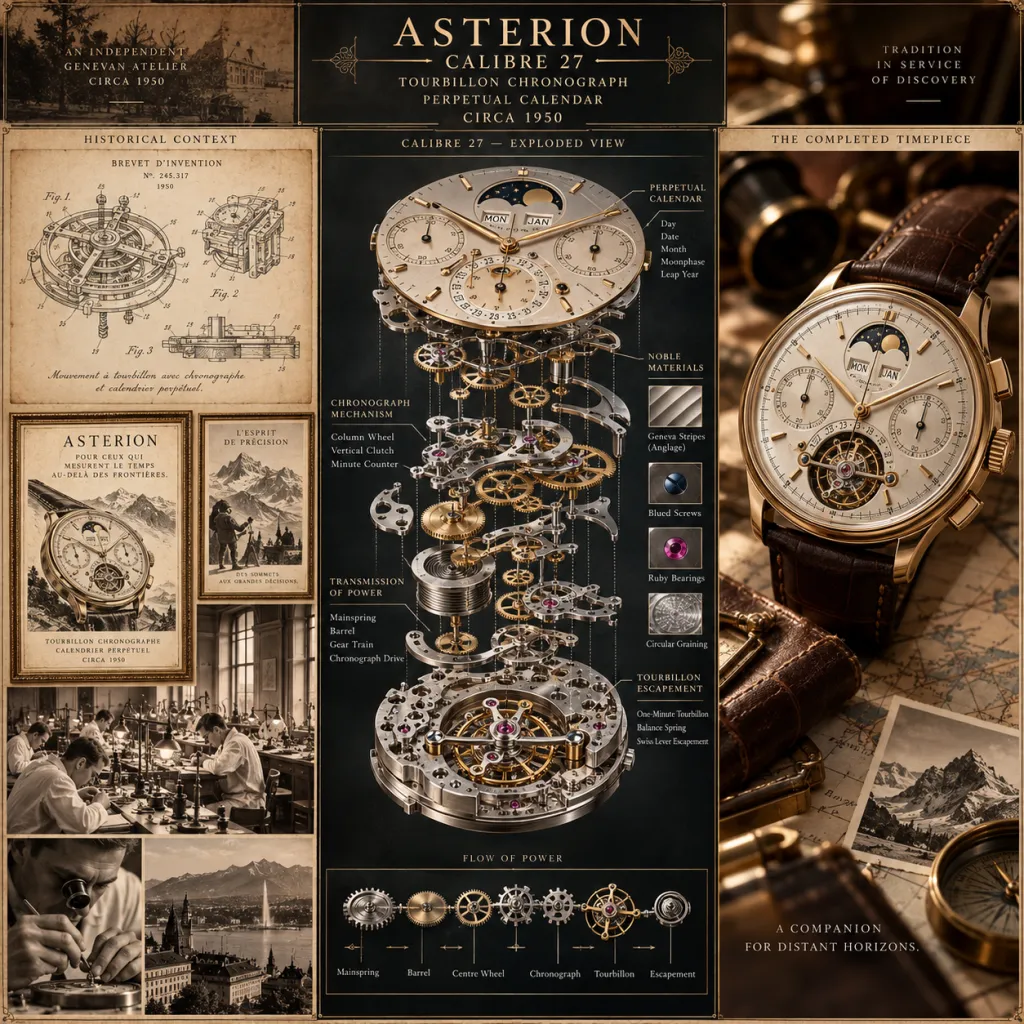
A central stack makes assembly order the main story. Simplify the surrounding panels and verify each part against a real diagram when accuracy matters.
View prompt & source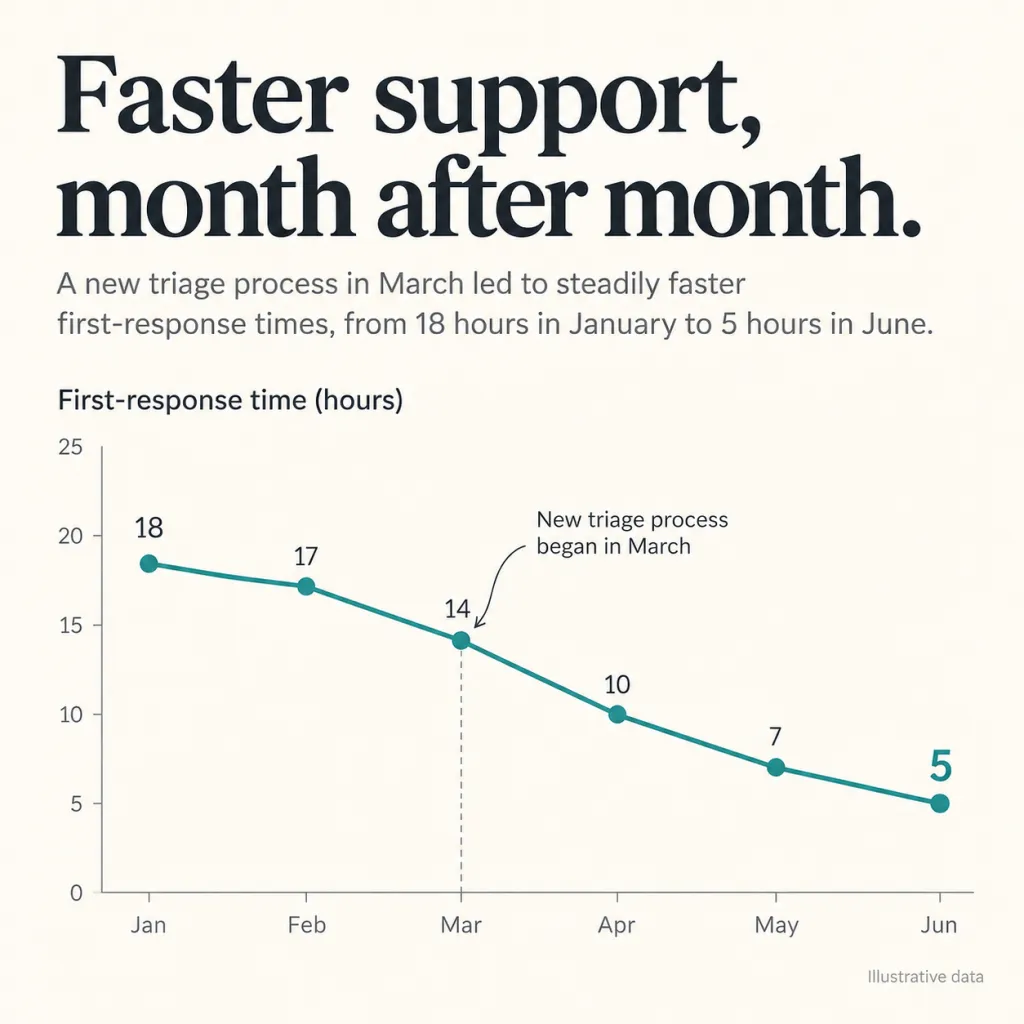
A restrained chart leaves room for a clear takeaway. Replace all example numbers with your verified dataset and plot the chart separately so spacing and scale remain accurate.
View prompt & source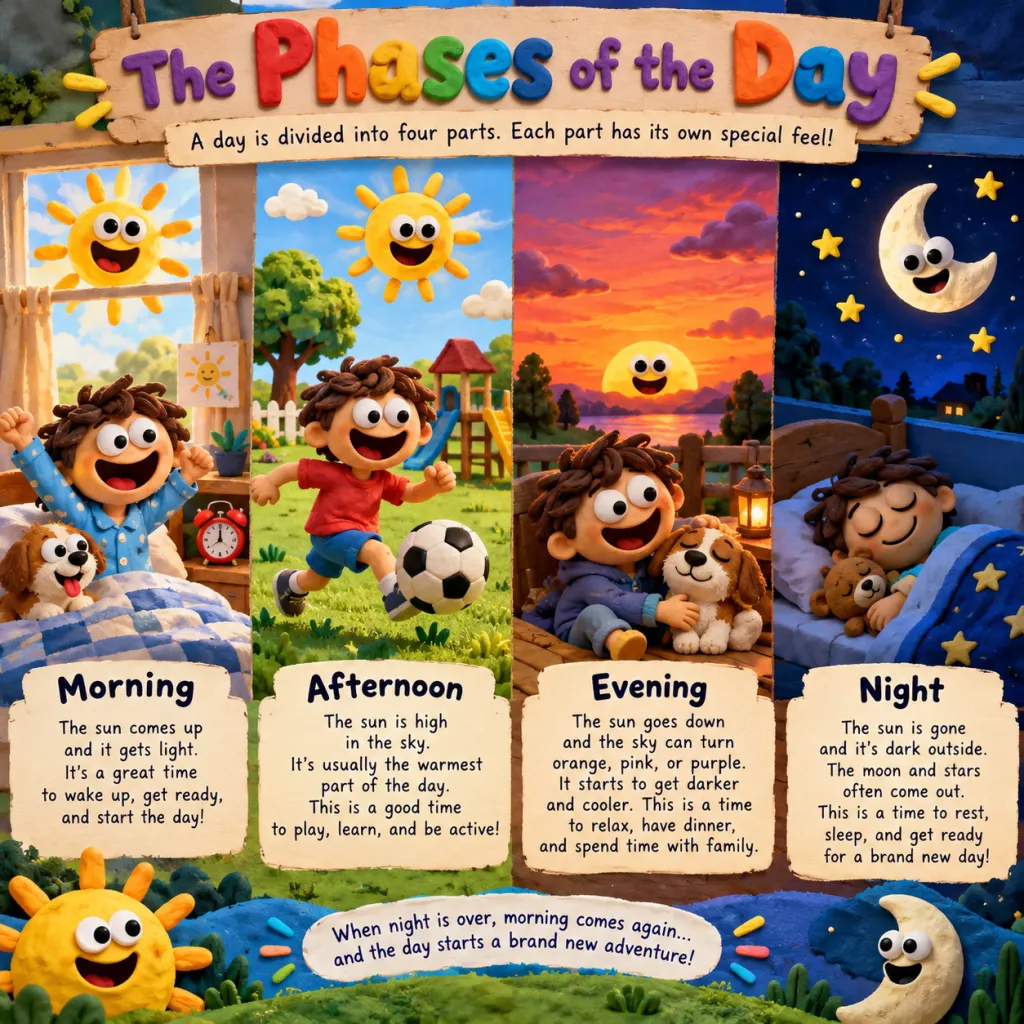
Equal columns make comparable stages easy to scan. Keep each caption similar in length and use consistent visual cues so the reader can compare without changing reading direction.
View prompt & source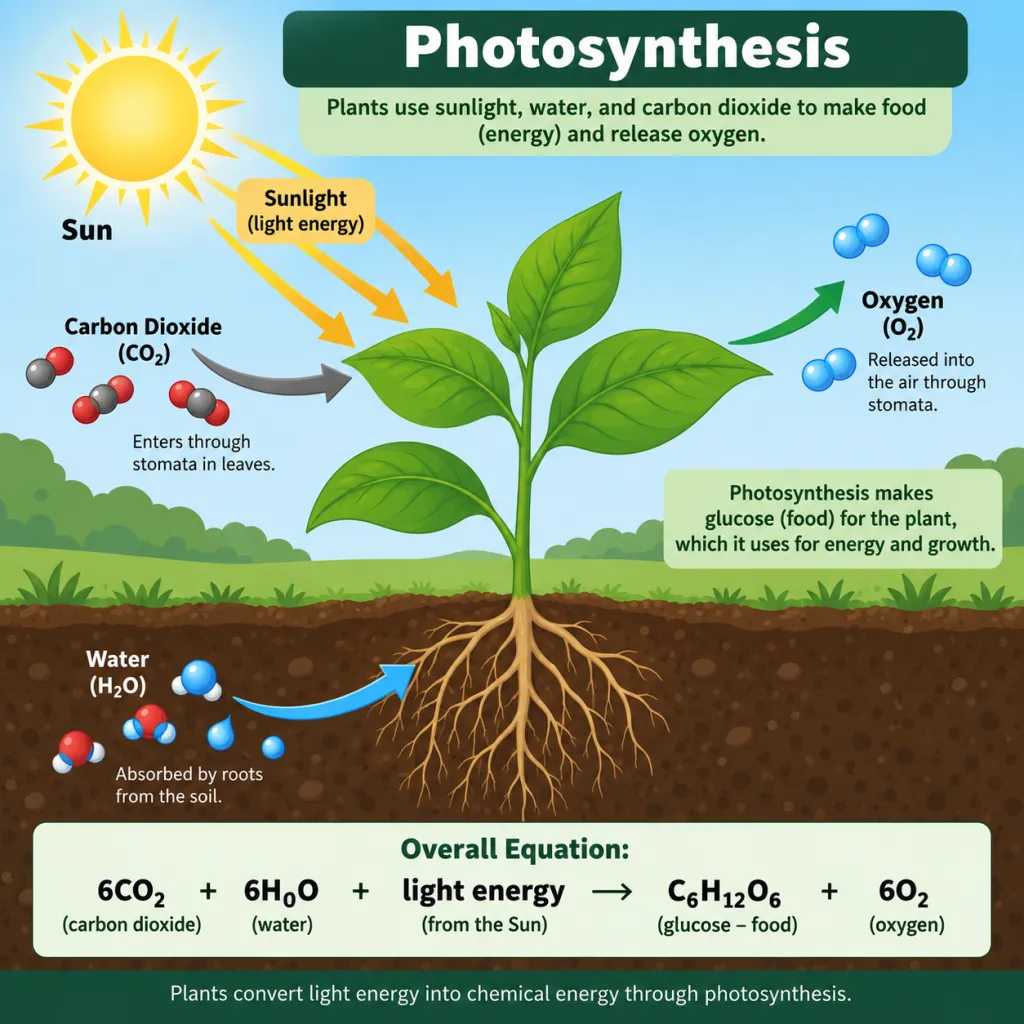
The plant is the central anchor for inputs and outputs. Supply checked labels, directions and equations, then inspect every arrow and term before using it as teaching material.
View prompt & source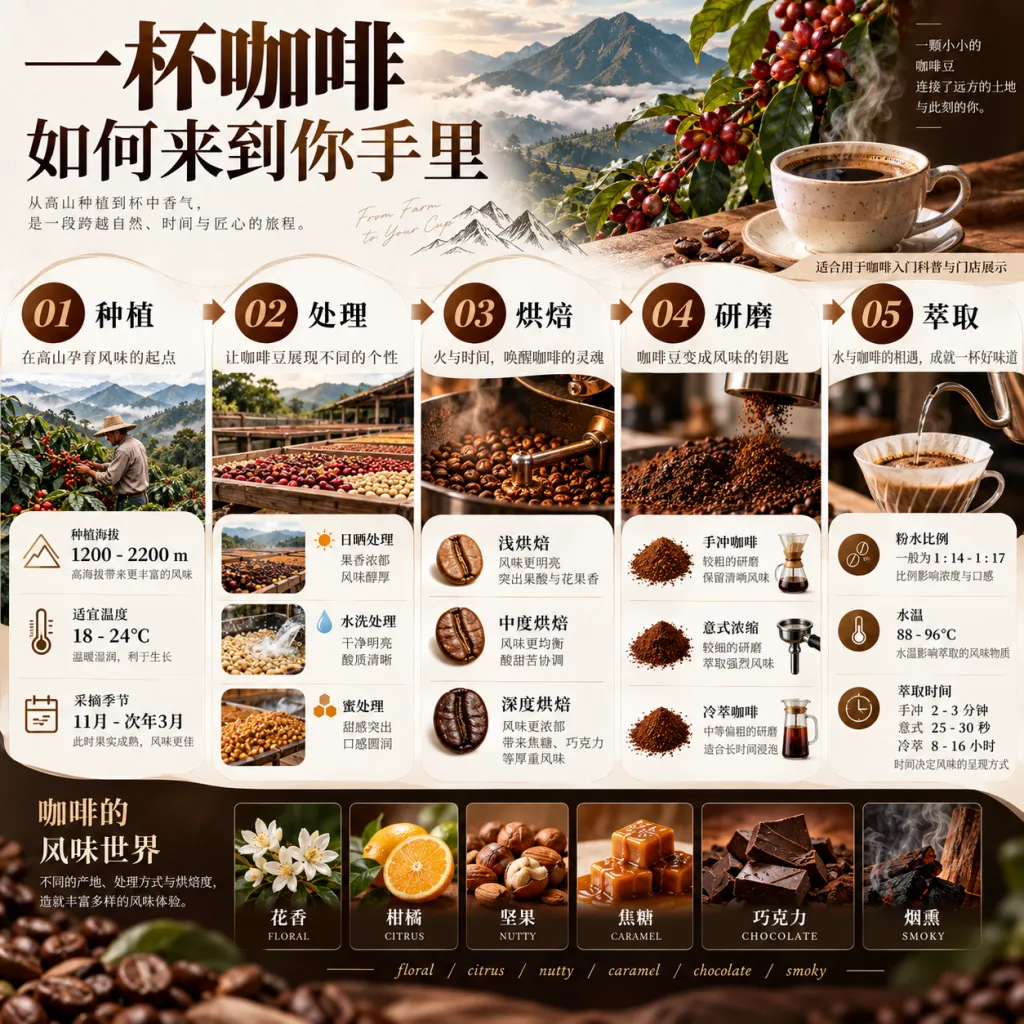
Numbered columns connect the origin story to the final cup. Write the actual steps first and keep each stage to one action; translate the labels deliberately for your audience.
View prompt & source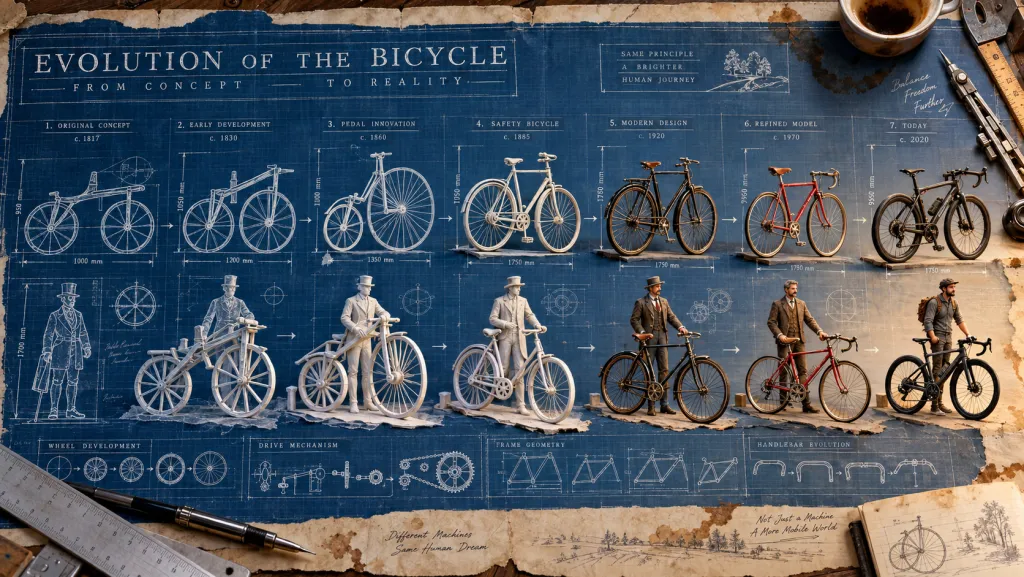
Repeated side views make changes in shape easy to compare. Use verified dates and matched scale, then give each stage a short caption that explains the change.
View prompt & source
The raised terrain makes the place memorable. Use this style for a visual overview, and pair it with an accurate map if readers need real navigation.
View prompt & source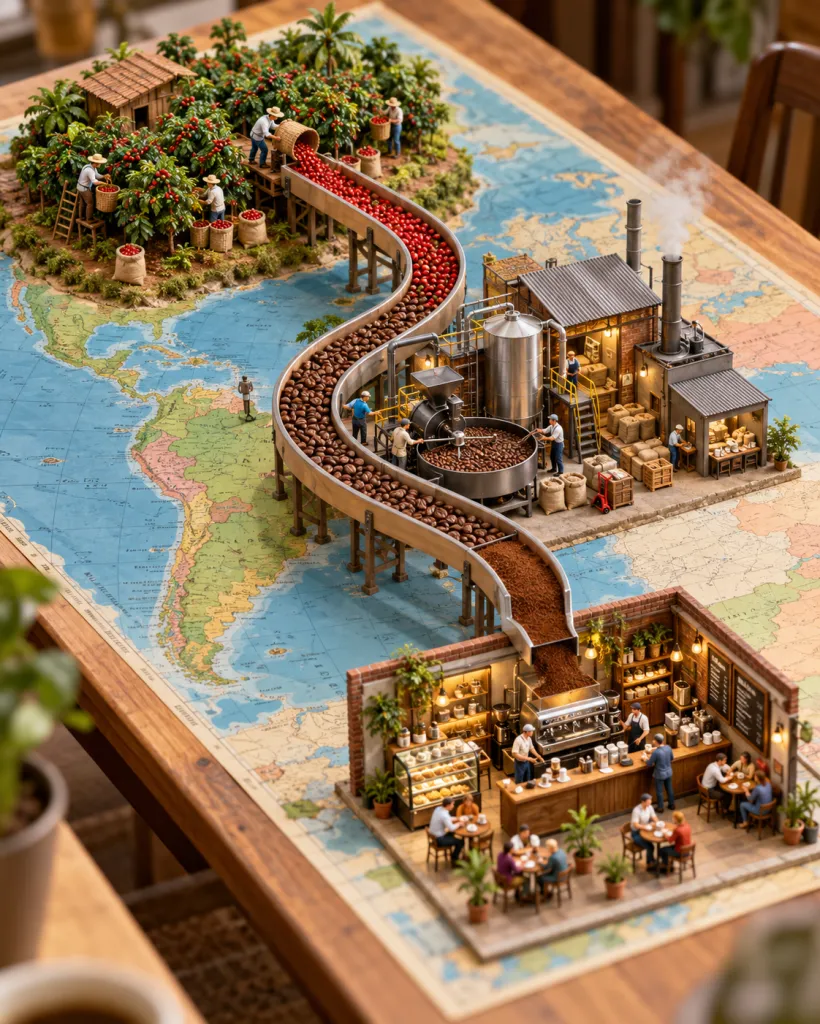
The track supplies a strong reading path across the scenes. Adapt each stop to one stage of your process, and make the start, direction and finish explicit.
View prompt & source03 / Before you publish
Trace every arrow from its starting point to its destination. Check that exploded parts, process steps and timeline items appear in the correct order.
Read small labels at the intended display size. Verify figures, units, dates and scientific terms against your source, including anything the image model added. Share the checked version rather than treating the generated draft as a factual reference.
Start your visual explainer by writing a custom prompt or pasting an unlocked layout brief. Choose an exploded view, timeline, or cross-section structure, set your preferred orientation, and generate. Inspect flow arrows, stage ordering, and visual hierarchy after download, then add verified data and exact typography in your design software.
Open generatorUse with Agent →Browse the full category →Compare Free and Pro